Data Science Project - Automated Excel Test Schedule with Azure DevOps APIs
📊 Automated Excel Test Schedule with Azure DevOps APIs
As part of my Integration Tester / Package Lead role at Equiniti, I developed an automated Excel-based Test Schedule that would automatically fetch updates from Azure DevOps using APIs to get updates on our test progress.
This was necessary because Azure DevOps (ADO) was not setup for our functional testing efforts and the management quickly reverted to Excel. When I joined they used a basic excel spreadsheet that had to be manually updated with numbers from Azure DevOps by simply going from tab to tab and copying numbers down.
I started working on automating this process and in a few months time we started implementing an automated version. As we know big organisations do not like change, especially when it's quick, which is why an automated excel spreadsheet allows for reporting to be viewed in a familiar format, while saving countless hours on data preparation as it can be uniformly fetched from ADO and preprocessed for analytics.
🎯 Project Impact
The Test Schedule is now being used across the entire project by multiple Test Leads and I actively manage the version, training and troubleshooting.
The test schedule is complimented by a Python script that allows for the most compute-intensive calculations which were necessary to generate a forecast baseline. This baseline and the end date it provides was key for reporting to stakeholders how the project is performing, which meant my calculations' formula had to be perfect.
I intend to make a more detailed tutorial of how I made this spreadsheet as I found that many of the solutions I implemented there were not easy to find on the web, for one because of the niche that this problem falls into.
🔧 Technical Challenges Solved
Some of the challenges included:
• Test Case ID Linking: How to link the Test Case ID which we had, with the Test Run ID which was hidden away in a different area of ADO (this was accomplished using APIs)
• Historical Data Download: How to create a mechanics whereby the entire history for a given Test plan can be downloaded
• Incremental Data Updates: How to make this download repeatable but only for a segment of the data to avoid having to redownload massive amounts of API data (this was achieved using query updates in Power Query that required tricking the query into updating itself but not overwriting existing data)
• Dynamic Baseline Generation: How to create a dynamic baseline that would autogenerate an Excel line graph whenever data is entered for a dynamic set of date ranges that would update with cell inputs
• Outcome Calculations: How to calculate Outcomes for a set of test cases based on hit by hit history that was available from ADO APIs, by turning it into a day by day outcome report using Python
• And many more hurdles
📈 Forecasting Capabilities
Baseline Forecasting Graph
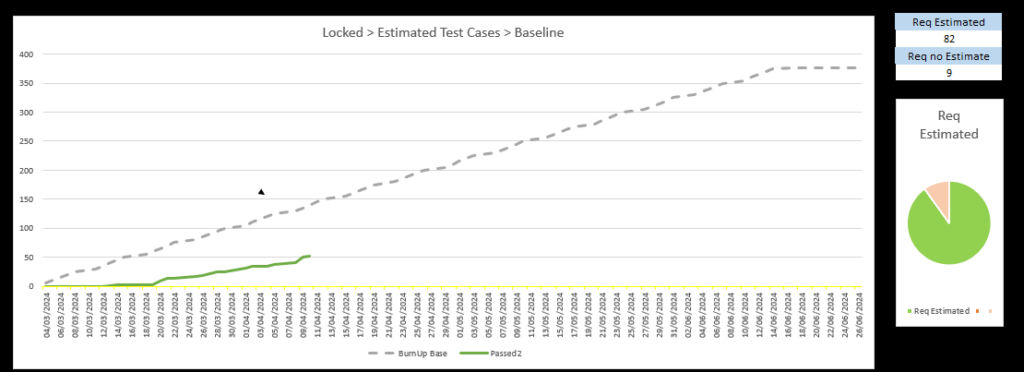 Dynamic baseline forecasting graph that automatically generates completion predictions based on current project data and team capacity
A new baseline prediction can be generated with a few settings changed in cells nearby to generate a hypothetical scope changes to the baseline should we add more people even during the project.
Dynamic Forecast Adjustments
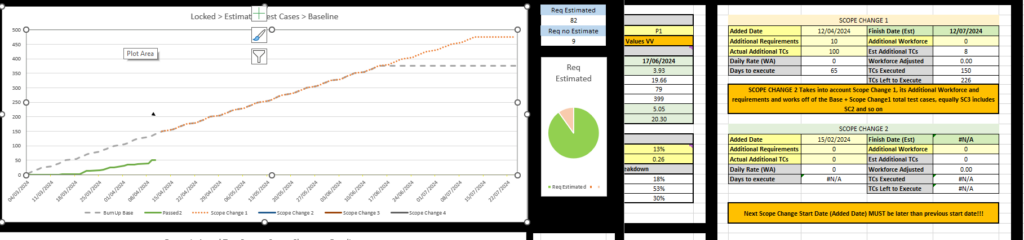 Image shows changes to forecast graph line based on changes to settings - in this case number of test cases
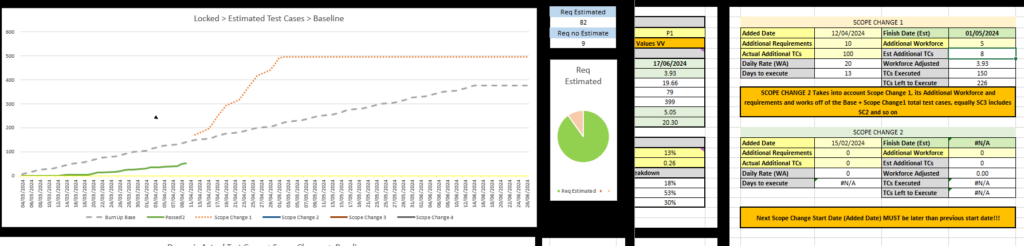 Image shows how the forecast graph changes based on changes to settings - in this case number of people was increased to bring completion date forward
Real-Time Baseline Updates
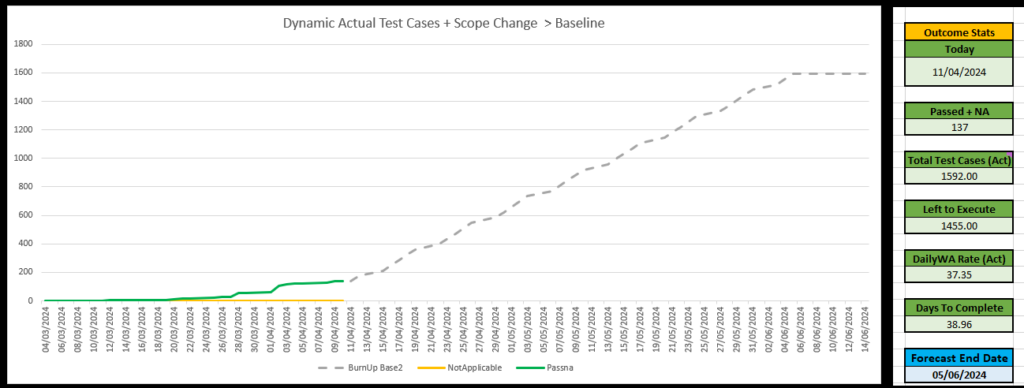 Image shows baseline adjust to current day data, such as number of test cases completed, based on the past data collected from ADO
🛠Bug Tracking Analytics
Bug Prediction vs Actual
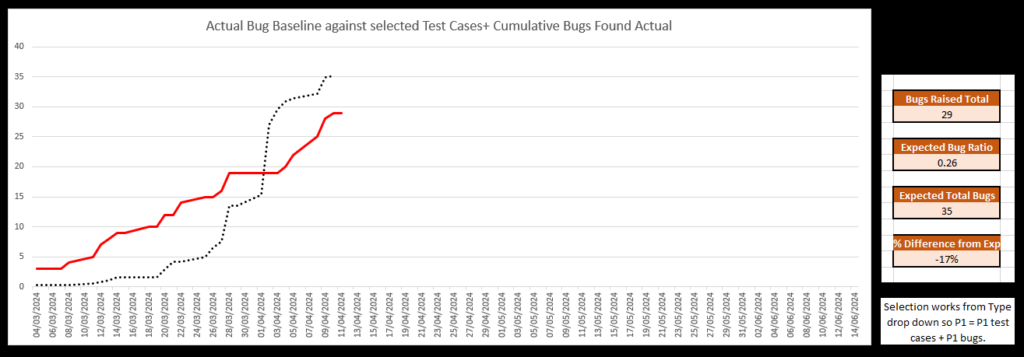 Image shows two lines generated dynamically from automatically refreshed data: the expected number of bugs based on number of tests executed (e.g. we expect 1 bug for every 4 tests executed) and the actual number of bugs found so far, which allows for quick assessment of project health
âš™ï¸ User Interface & Controls
Settings UI for Estimates
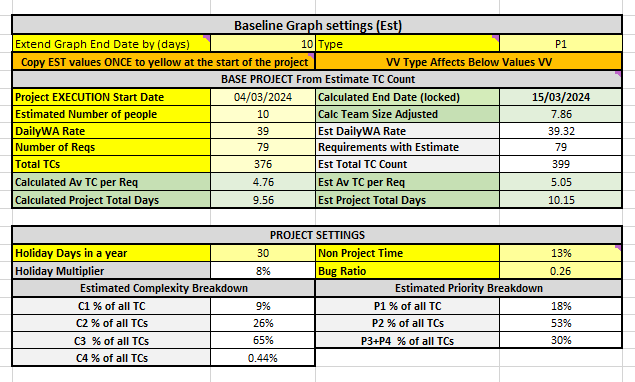 Image shows settings UI that allows for quick changes to the forecast baseline, such as number of test cases, number of people working on the project, and expected bug rate. Most values are locked in as are already automatically calculated or project wide for consistency. This picture shows the Estimate graph lines
Settings UI for Actuals
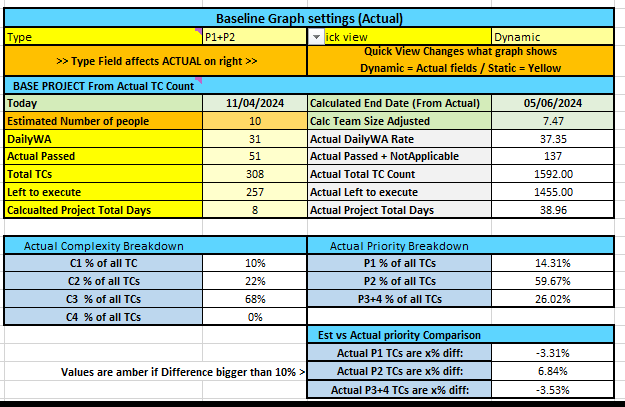 Changes in these settings affect the Actual graph lines
🧮 Complexity Calculations
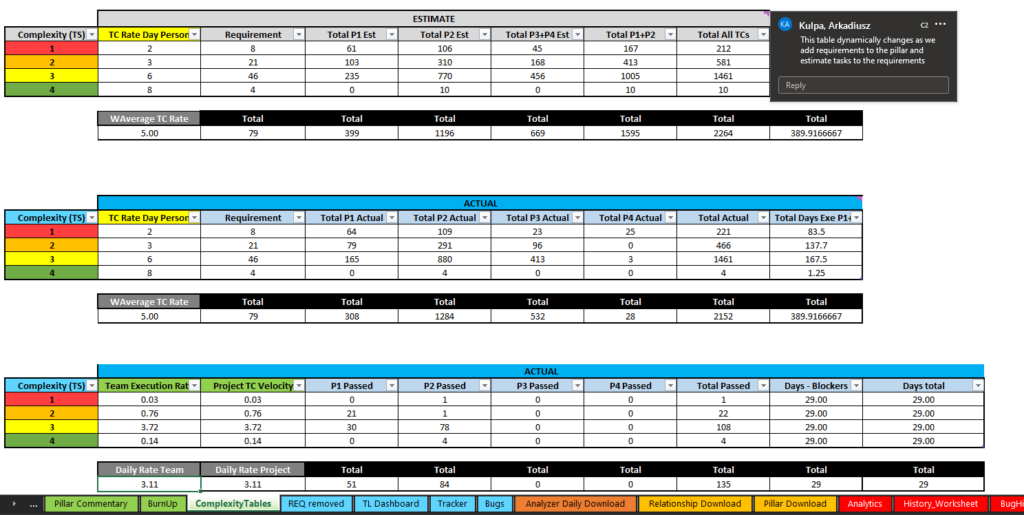 Image shows complexity calculations that are used to generate the forecast baseline, such as a level of complexity 1 - 4 is used together with an expected rate of completion of test cases per person to arrive at an expected completion variable given number of estimates of various complexities pulled directly from ADO API
🔄 Daily Operations
One-Click Data Refresh
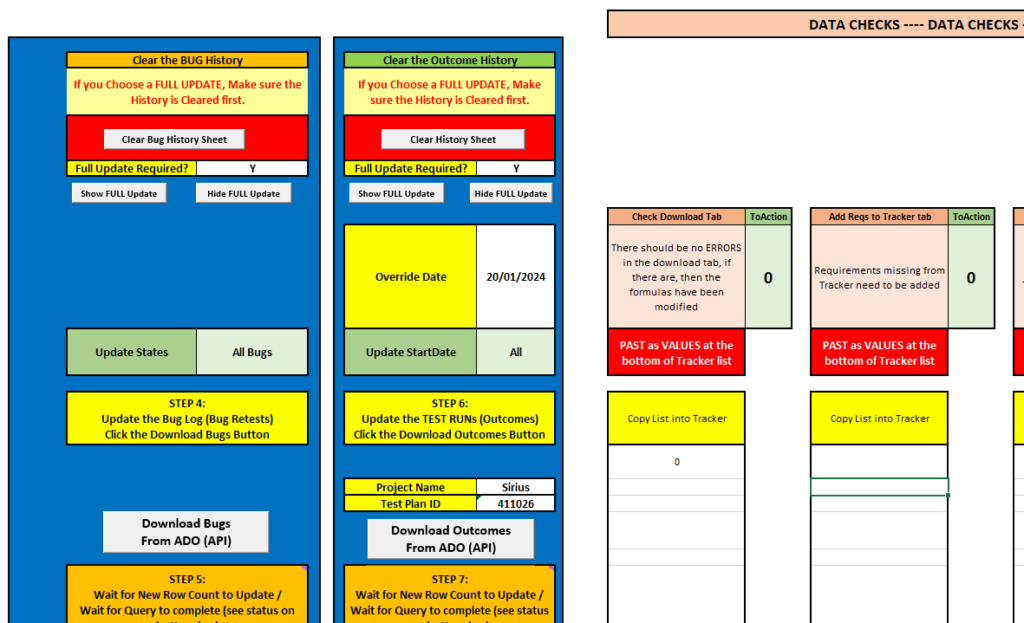 Human operator was left to only click a few buttons to refresh the data, which would then automatically update the entire spreadsheet with new data from ADO, including the forecast baseline and the graphs
📊 Advanced Analytics with Python
The Test Schedule needs an up to date Outcome value (latest) in order to work out the forecast from today's situation:
Example Calculation: 50 passed, 200 total, 150 left to go, 2 people working, each can do 5 TCs a day, so they can do 150 TC in 150 / (2×5) = 15 work days, etc.
However the usual BurnUp also should show a graph line made up of past updates, e.g. how many Passed Outcomes were there on each day for the last month. This previously required updating the test schedule manually every day by copying the Passed number from ADO along with other numbers such as:
• Blocked 🚫
• Failed âŒ
• Not Applicable âï¸
In this automated version of the test schedule it was impossible to automate this aspect of the process within Excel, due to the number of calculations and iterative nature of them, which was why Python standalone executable was developed by myself as solution to this.
🔠ADO Analyzer - Python Solution
The ADO Analyzer takes in the Test Schedule as input and outputs another .csv spreadsheet with a table that can then be pasted into the Test Schedule that will generate the Outcome statuses (or Outcome history for each day of the project).
The Git Repo is publicly available here. The program uses the Test run history downloaded from ADO into the Test Schedule, which is a step by step record of runs that have been performed on the project to amend statuses of test cases chronologically and save the outcome status for a given day when it moves on to the next day.
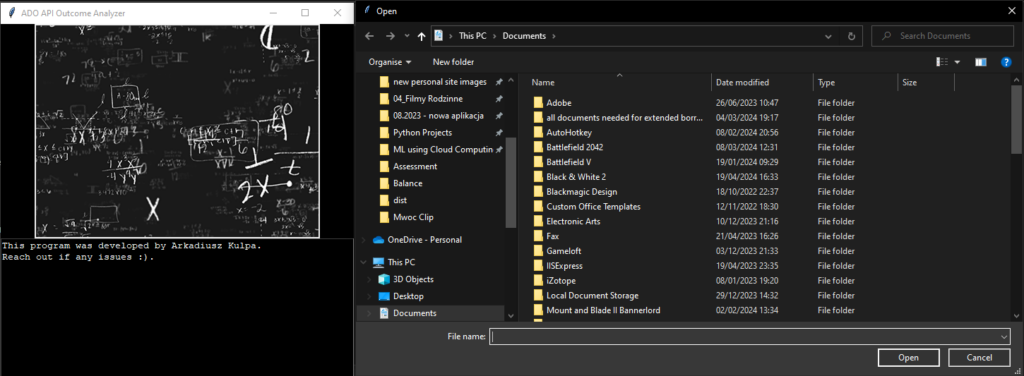 The ADO Analyzer is a Python standalone program that processes the Test Schedule data to generate a daily outcome report, which can then be pasted into the Test Schedule for further analysis and forecasting
🚀 Professional Impact
This project demonstrates:
• Enterprise Automation: Transforming manual processes into efficient, automated workflows • API Integration: Seamless connection between Azure DevOps and Excel analytics • Data Science Application: Advanced forecasting and predictive analytics • Cross-Platform Solutions: Excel + Python + Power Query integration • Change Management: Successfully introducing automation in traditional enterprise environments
Status: ✅ Production Deployment
Current Usage: Multiple Test Leads across entire project
Technology Stack: Excel, Azure DevOps APIs, Python, Power Query